
APP usage and App threat report 2024
According to the Netskope Threat Labs report 2024, app usage is rising fast, with the average user utilising 20 different apps per month – a 19% increase from just two years ago. Currently, half of...
.png)

APP usage and App threat report 2024
According to the Netskope Threat Labs report 2024, app usage is rising fast, with the average user utilising 20 different apps per month – a 19% increase from just two years ago. Currently, half of...
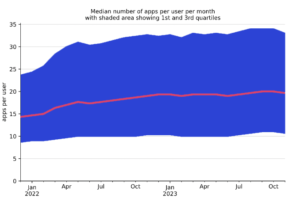
According to the Netskope Threat Labs report 2024, app usage is rising fast, with the average user utilising 20 different apps per month – a 19% increase from just two years ago. Currently, half of all enterprise users access between 11 and 33 apps monthly, with the top 1% interacting with a staggering 96+ apps. Organisations are recognising the advantages of cloud migration beyond productivity tools. Niche applications are now becoming prime candidates for this shift, driven by the potential for increased agility, security, and scalability. But which Apps do businesses and their employees use the most? And which ones have carried the most threats?
How many apps does the average business user use?
Chart 1: Median Number of Apps per user 2022-2023
Which apps do business users use the most?
The most popular apps used by enterprises over this period has not changes significantly. The same main players still feature with little percentage movement. Chart 2: Overall Popularity of Apps by user 2022-2023
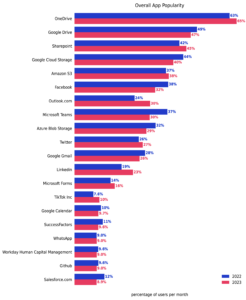
The Google and Microsoft productivity suites’ applications accounted for the majority of the top ten most used Apps.Microsoft products OneDrive, Sharepoint, Teams, Azure Blob Storage, Outlook.com, Forms, and GitHub along with Google products Google Drive, Google Cloud Storage, Gmail, and Calendar all featured either individually or as part of the greater suite. Interestingly, Whatsapp is “only” used by 9% of business users. This is generally American data and could be far greater in other countries. Linkedin usage has seen a significant 20% increase over this period. Gmail business usage over this period actually shrunk, with presumed beneficiaries being Outlook which went up 6% points over the year.
What Apps do cyber attackers target the most?
As we become more and more wedded to app usage, it’s probably no surprise that the attackers are also upping their threats by relentlessly developing new variations and disguises. In 2023, on average, 8 out of every 10,000 users unwittingly downloaded an average of 11 Trojans each month. This translates to a potential exposure of 132 Trojans downloaded onto a network with 10,000 users throughout the year. It’s also probably no surprise that the Trojan developers are attacking the most popular apps, and the ones we like using the most. The following figure breaks down the top 20 apps, including a year-over-year comparison. Chart 3: Top Apps where malware downloads were detected 2022 and 2023
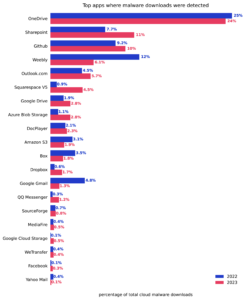
It’s worth comparing the above chart with Chart 2, to see differences between usage and malware attacks. Google Drive for example is second on the afore chart, but 7th in this one. It’s also worth seeing where the increases were year on year in this chart, which seem to correlate with increased usage in the aforementioned chart. However, one consistent thing is that apps which offer free file hosting software are most prone to attack and make up the majority of this list. Because these apps provide low-cost or no-cost file hosting, the team at Netskope Threat Labs expects them and similar apps to continue to be abused for malware and phishing delivery for the foreseeable future. Taken and rewritten from: https://www.netskope.com/netskope-threat-labs/cloud-threat-report/cloud-and-threat-report-2024
Book your free X-Ray Assessment discovery call
Get confident in your cybersecurity posture in just 30 days.
Book a discovery call now to find out how.
.svg)
